Marketing
Surveys
Dynamics 365 Customer Voice provides survey capabilities and has deep integration from the Dynamics 365 line-of-business applications (FieldConnect365) and built on Microsoft Forms, Dynamics 365 Customer Voice adds rich insights by feeding real-time survey data into customer records. Dynamics 365 Customer Voice provides an easy and friction-free experience, from creating surveys to generating actionable insights based on customer feedback with minimal setup time. It helps you to keep a pulse on what customers value and how they view your products and services, so you can rest assured that your data is supported by Microsoft security and compliance policies.
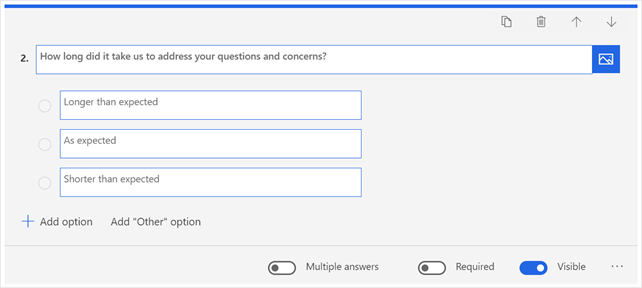
The creation of surveys is achieved by using the built in design tools with supported question types being:
- Choice: A Choice type question gives respondents a list of answers to choose from.
- Multiple answers: respondents choose one or more answers from the list by selecting one or more check boxes.
- Text: A Text type question can accept a short (one-line) answer or a long (multiple-line) answer.
- Ratings: A Rating type question asks respondents to rate their answer by using stars, numbers, or smiley symbols.
- Date: A Date type question displays a calendar and asks the respondent to select a date.
- Ranking: A Ranking type of question asks a respondent to rank items by arranging them in the order of the respondent's preference.
- Likert: A Likert type question displays a list of single-answer questions and a rating scale for the answers, so a respondent can select a value from the scale to answer each question.
- File upload: A File upload–type question asks a respondent to upload a file.
- Net promotor score: A Net Promoter Score type question asks a respondent to rate the likelihood of their recommending a product or service to a friend.
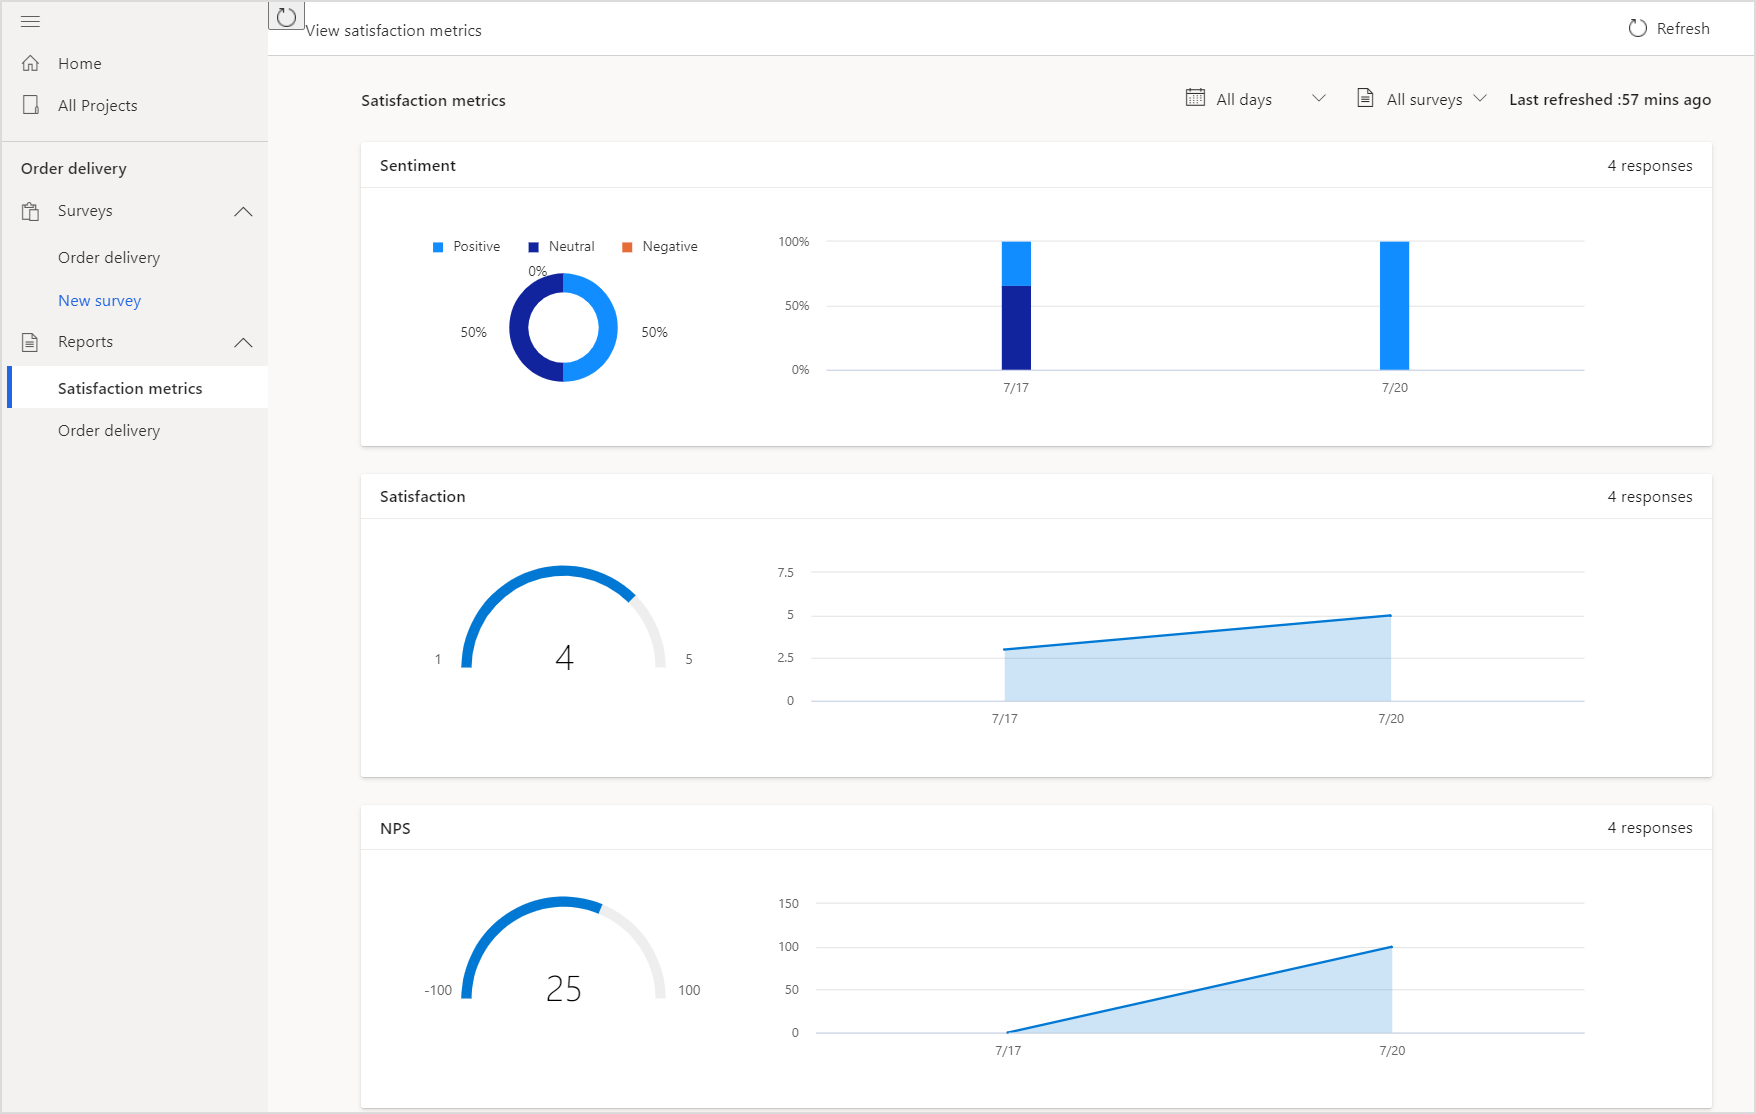
The satisfaction metrics dashboard is automatically generated for each set of metrics, displaying recent scores and trends. Once survey responses are received, you can view and analyse the results in the Reports section on the left pane.
The following charts are displayed for the metrics:
- Net Promoter Score: A meter chart shows the score for the metric. The area chart toward the right of the meter chart shows the trend of Net Promoter Score for the selected time period.
- Sentiment: A pie chart shows the distribution of positive, neutral, and negative sentiments for the metric. The stacked column chart toward the right of the pie chart shows the distribution of positive, neutral, and negative sentiment for the selected time period.
- CSAT: A meter chart shows the score for the metric. The area chart toward the right of the meter chart shows the trend of CSAT scores for the selected time period.
- Custom score: A meter chart shows the score for the metric. The area chart toward the right of the meter chart shows the trend of custom scores for the selected time period.